It doesn’t matter if you’re brand new to using Google Analytics for marketing or a seasoned inbound marketing vet, the platform has so much data that it can be difficult to see the forest for the trees, especially if you’re involved in a big project.
The good news is that, whether you’re working on a newer, small project or have been elbows-deep in a big one for years, there are five reports in Analytics that you can use as the foundation for a killer digital marketing strategy, or as a way to reset your previous plan.
Table of contents
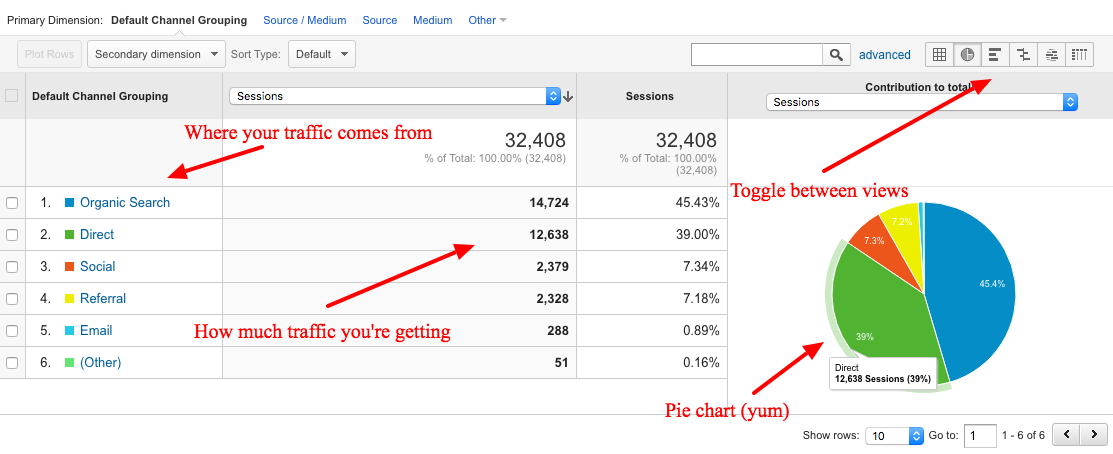
Channels
Why: An oldie but a goodie, the channels report is a great way to see where most of your traffic comes from and to determine which avenues are most profitable. But where this report becomes extremely valuable for marketing is when looking at it over long periods of time. Compare Q1 of this year to last year—where are there big changes in traffic, engagement or revenue? What caused them?
How: Once you have an understanding of why what happened happened, use this knowledge to inform your strategy—did an increase in advertising spend correlate to an increase in revenue? Did a new website drive higher engagement? Did a commitment to a content and social media strategy increase referrals? Analyzing at this level will help you to determine where to allocate funds when planning budgets and where to devote resources when fine-tuning your strategy, so don’t start and stop solely with looking at the data—think about it, engage with it and use it to grow!

Devices
Why: Mobile is increasing its market share every day (commonly, this is written as “Mobile traffic still growing,” which is a bit misleading), but it’s not growing as quickly for some brands as it is for others, and an increase in mobile traffic doesn’t necessarily guarantee an increase in spending or leads. In fact, for many big-box retailers, mobile traffic converts at a significantly lower rate than does desktop traffic.
How: This report can be used to determine where your visitors are when they come to your site, which is an important metric when using Google Analytics for marketing purposes. If visitors are finding you on their mobile devices, odds are they’re not going to be as engaged as those who made the commitment to pull up your site on their desktop or laptop. Using secondary dimensions can help you determine which channels mobile users are more likely to come from or whether or not desktop users are likely to be repeat visitors or new users (having enhanced e-commerce and cross-device functionality enabled will help to make this report even more useful!), and having this information may help you to structure advertising campaigns or social posts to better grab the attention of an audience segment that’s more likely to convert, or that needs a bit more nurturing.
Return visitors
Why: Often overlooked because of its simplicity, this is actually one of the most instructive reports for those of us using Google Analytics for marketing. Simply put: over a long period of time, returning visitors are more likely to convert on your site because they’re more familiar with your brand (new visitors may convert more regularly if there’s a promotion targeting them, but this shouldn’t hold after the promotion has run its course). There’s no golden ratio of new to returning visitors, but 60 percent returning visitors is a great number to shoot for.
How: It may also be useful to use this report with a secondary dimension invoking channels or devices to see which places it’s more likely for return traffic to come from, so that you can beef up efforts on the under-performing areas.
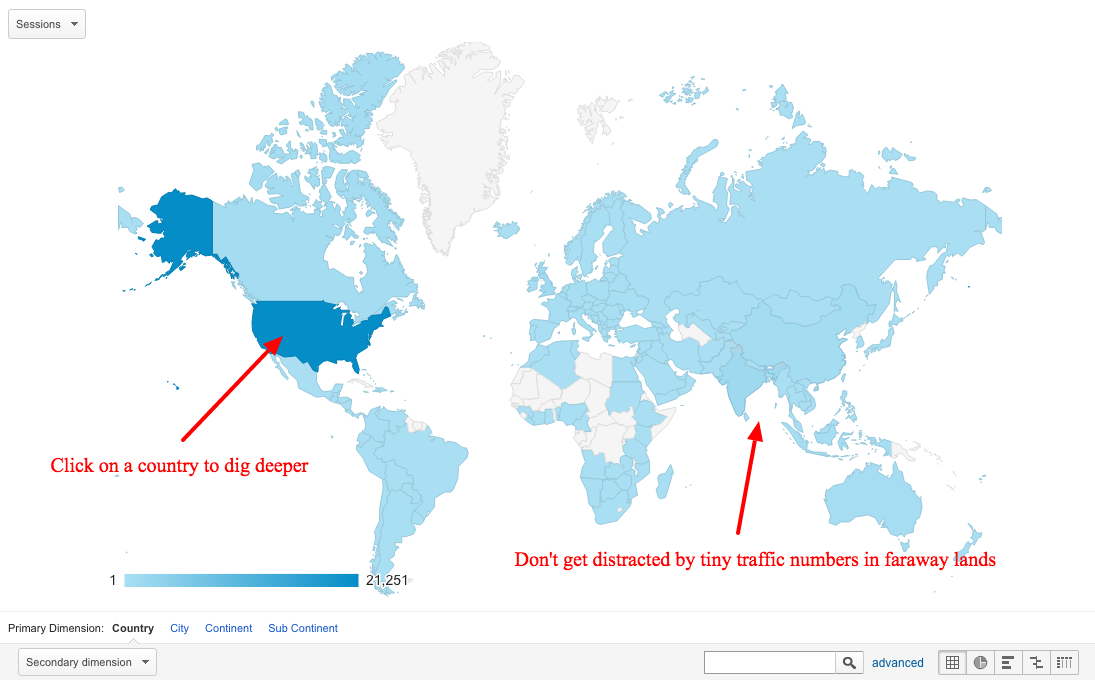
Location
Why: Maybe you’re a small business with a local following who thinks that you don’t need the location report because your reach is only within your county. Wouldn’t you still want to know if you had a lot of traffic from a certain city within your county, or if you saw a spike in traffic from another state as a result of an awareness campaign?
How: The location report may not tell you anything that you don’t know about your traffic, but it may surprise you to learn where most of your sales or leads are coming from. No matter how much you optimize your digital marketing, offline word-of-mouth still plays a very large part in driving not only traffic, but also conversions. Overlooking the location report means overlooking potential low-hanging fruit opportunities to grow your business, so do so at your own risk.

Demographics
Why: You may think that you know your audience, but do you know your digital audience? While not nearly as robust as Facebook’s Audience Insights, Google Analytics’ demographics reporting provides insights on the ages and genders of your users. Use one as your primary and the other as your secondary dimension to see which audience segment is the most likely to access and/or convert on your site, or use devices as your secondary dimension to see who may be more likely to access your site from home or the road.
How: Fortunately, Google’s age segments match up perfectly with Facebook’s, so you could use the information that you gather from Analytics in conjunction with your Facebook data to build your most comprehensive audience profile yet! How do you use an audience profile for digital marketing? Turn it into comprehensive, fully-developed buyer personas. This is one of the best things you can do if you’re using Google Analytics for marketing, particularly if you’re building a strategy from the ground up, so to speak.
As anyone who has used Google Analytics for marketing can tell you, there are probably hundreds of different ways to view and make use of the metrics provided, but start with these five to really make your digital marketing plan effective.


